AIoT in Manufacturing: Real Cases, ROI, and a Pilot Playbook


AIoT delivers on the shop floor when it cuts unplanned downtime, scrap and energy, and lifts throughput. PLCs, drives, vision systems, meters, and RTLS stream data into models that predict failures, catch defects early, tune recipes, and shift loads.
This article continues our series on AIoT technology with a factory lens: what to automate, where to run models (edge/cloud/hybrid), and how to prove value fast with real cases, ROI-ready KPIs, and a copy-paste cost-vs-benefit example.
No fluff, no vendor pitch – just steps, numbers, and patterns you can apply from one of the top Internet of Things software development companies.
The Wave of Innovation – How AI-Powered IoT Looks in Manufacturing
Case 1 – Automotive (BMW Group)
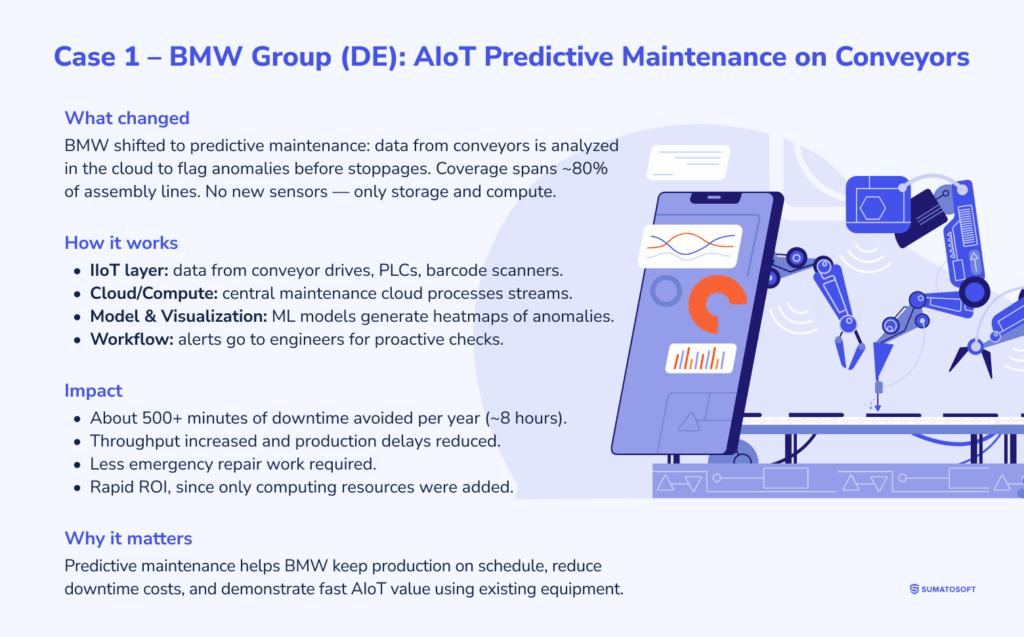
BMW’s Regensburg assembly plant now uses AIoT to monitor its conveyor systems in real time. Data streams from existing conveyors (motor drives, barcodes, etc.) feed into BMW’s cloud platform, where in-house machine-learning models analyze patterns and flag anomalies. No extra sensors were needed – only storage and computing power.
The company integrated AI into its business to enable predictive maintenance, which has been scaled to about 80% of the main assembly lines and helps technicians respond before faults cause a line stop. The result: roughly 500+ minutes of assembly downtime avoided per year (about 8+ hours). In practice, this means BMW can deliver scheduled production on time and reduce costly rush-repair work. Models run in the cloud, generating “heatmaps” of abnormal conveyor behavior so teams can pinpoint and fix issues proactively.
Deployment: IoT data from existing equipment is sent to BMW’s central maintenance cloud (no new hardware). ML anomaly-detection models with heatmap visualizations run in the cloud and alerts are pushed to engineers.
Results: Conveyor downtime at Regensburg is reduced by ~500+ minutes per year. This boosts throughput, avoids delays, and delivers rapid ROI since only compute costs are added.
Case 2 – Food & Beverage (Frito-Lay, PepsiCo)
At Frito-Lay snack plants, AIoT systems developed with startup Augury combine IoT sensors on key equipment with cloud AI analytics to predict failures in potato-chip production lines. In one multi-plant pilot, vibration and condition sensors with ML models generated an extra ~4,000 production hours per year and prevented about 1.0 million pounds of product waste by catching faults early. Overall, factory metrics dropped to about 0.75% planned downtime and 2.9% unplanned downtime. Across dozens of plants, the system has already averted on the order of 4,500 hours of unplanned downtime.
Deployment: IoT sensors (e.g., vibration and acoustic monitors on motors and pumps) feed live data to cloud-based AI models. Deep-learning models detect subtle anomalies (bearing faults, leaks, misalignments) that humans often miss. Alerts prompt maintenance before breakdowns occur.
Results: The core impact of IoT on business is that production throughput rose by about 5%, capturing an additional half-million dollars per week in productivity in one case. For Frito-Lay, capacity gain of ~4,000 hours per year and major waste avoidance (~1 million lbs) were documented. Downtime fell to below 1% planned and ~3% unplanned. The project delivered a fast payback by preventing line stoppages and scrap.
Where AIoT Pays Off in U.S. Manufacturing
U.S. factories show a clear pattern: sensors on assets, line-side cameras, and RTLS/wearables stream data that models use to predict failures, catch defects in-line, tune energy use, and keep people safe – in real time.
To understand how IoT in manufacturing works, we prepared a table.
The table maps where this happens on the floor, the methods behind it, the typical lift to OEE/scrap/energy/labor, and named U.S. rollouts that prove the gains. Use it to spot data-ready areas in your plant and set a realistic ROI target before you pilot.
| Item | Description |
|---|---|
| AIoT usage | IoT sensors on factory equipment (motors, robotics, etc.) feed real-time data (vibration, temperature, etc.) into AI models that predict failures before they happen, allowing maintenance to be scheduled proactively instead of reactively. |
| AI methods | Primarily supervised machine learning and time-series analysis on sensor data (e.g. anomaly detection in vibration/temperature patterns). Techniques range from regression models to deep neural networks for pattern recognition. Some manufacturers use deep learning (RNN/CNN) on streaming data and predictive analytics to forecast parts. |
| ROI impact | Predictive maintenance significantly reduces unplanned downtime (studies report up to 50% less downtime in operations) and lowers maintenance costs by 10-40%. It also extends equipment life and improves production efficiency. In fact, one analysis found that implementing AI-based predictive maintenance can yield an average ROI of ~250%, meaning the benefits return more than double the investment. |
| U.S. example | General Motors (GM) equipped assembly-line robots with IoT sensors and AI analytics to monitor wear. This cut unexpected downtime by ~15% and saved about $20 million per year in maintenance. Another example is Frito-Lay, which used a predictive IoT system to drop planned downtime to near-zero (0.75%) and limit unplanned outages to ~2.9%, preventing major equipment failures in their production. These cases show how U.S. manufacturers reap big returns by avoiding costly breakdowns and keeping factories running smoothly. |
Building the Next Successful AIoT Case in Manufacturing
This part turns an AIoT idea into a pilot that ships. You’ll pressure-test whether AI beats simple rules, avoid classic blockers (thin data, no owner, blocked PLC/SCADA/MES/ERP paths), and run a one-week scan to pick a high-ROI, feasible case.
We’ll spell out minimum data (sensor history + labeled outcomes), edge vs. cloud deployment, and the integrations needed so the model can actually change the line.
The output is a one-page pilot brief with baseline, target, owner, and a 30-90-day path to impact on OEE, downtime, scrap, and energy.
Is AI in IoT Right for You
A) Key Signs Your IoT Project Will Benefit From AI
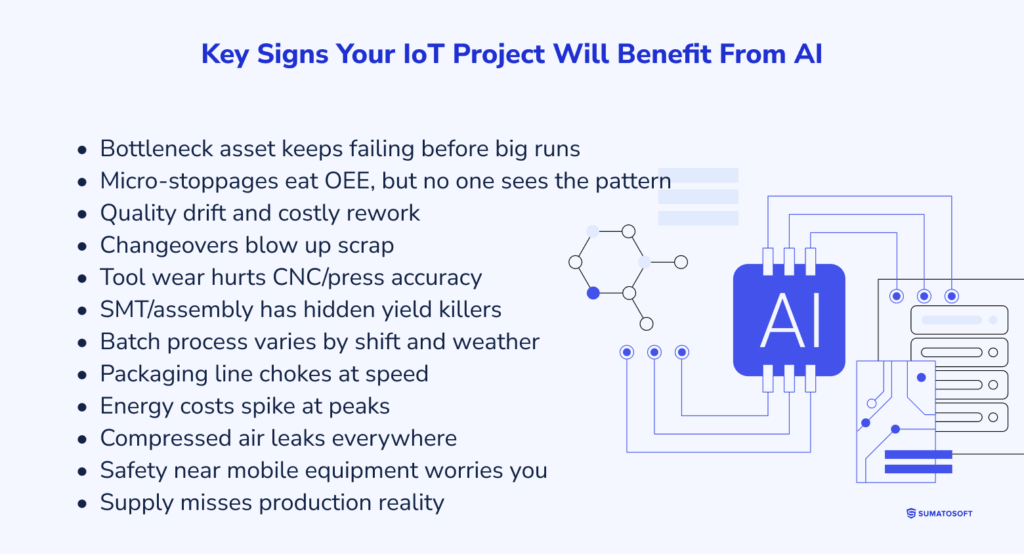
As a top AI development company, we suggest examining three aspects: real shop-floor pains, the data you already have, and what AI actually unlocks.
- Bottleneck asset keeps failing before big runs. Data/devices: vibration/thermal on motors, PLC fault logs, drive current, CMMS tickets. AI unlocks: failure-window prediction, auto-created work orders, and fewer line stops.
- Micro-stoppages eat OEE, but no one sees the pattern. Data/devices: high-frequency PLC tags, andon events, speed setpoints, encoder counts. AI unlocks: micro-stop clustering, root-cause hints (upstream jam, sensor misalignment), targeted fixes.
- Quality drift and costly rework. Data/devices: inline vision frames, torque/force curves, SPC streams, recipe parameters. AI unlocks: anomaly detection on traces, live parameter tuning, and false-reject reduction.
- Changeovers blow up scrap. Data/devices: setup sequences, servo loads, temperature/pressure ramps, first-article results. AI unlocks: changeover recipe optimization, “golden run” comparison, scrap cut in the first hour.
- Tool wear hurts CNC/press accuracy. Data/devices: spindle vibration, power draw, acoustic emissions, tool counters, part metrology. AI unlocks: remaining-useful-life for tools, just-in-time change, stable Cp/Cpk.
- SMT/assembly has hidden yield killers. Data/devices: AOI images, placement offsets, reflow profiles, feeder error codes. AI unlocks: defect pattern mining, per-feeder maintenance cues, reflow profile optimization.
- Batch process varies by shift and weather. Data/devices: historian tags (flow/pressure/temps), raw-material COA, ambient data. AI unlocks: multivariate control suggestions, recipe trims by lot/ambient, tighter spec bands.
- Packaging line chokes at speed. Data/devices: photoeyes, jam sensors, capper/labeler torque, rejected counts. AI unlocks: early jam risk alerts, speed-curve coaching, smoother ramp to design rate.
- Energy costs spike at peaks. Data/devices: sub-meters, compressor/oven telemetry, utility tariff/peak events. AI unlocks: load forecasting, peak shaving, shift recipes to cheaper windows.
- Compressed air leaks everywhere. Data/devices: flow/pressure sensors, compressor cycles, zone meters. AI unlocks: leak localization, savings calculator, auto-create maintenance routes.
- Safety near mobile equipment worries you. Data/devices: RTLS for forklifts/AGVs, proximity beacons, zone sensors. AI unlocks: near-miss detection, geofenced slowdowns, coaching by hotspot map.
- Supply misses production reality. Data/devices: MES schedule vs. actual, ERP work orders, WIP trackers, buffer levels. AI unlocks: dynamic rescheduling, buffer right-sizing, and fewer changeover whiplashes.
B) When AI Is Overkill (For Now)
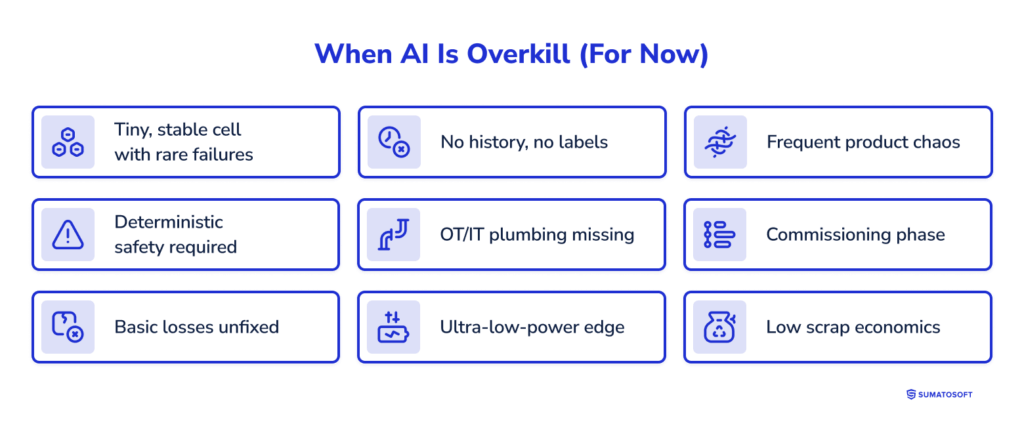
Manufacturing scenarios where rules, maintenance basics, or simple automation win.
- tiny, stable cell with rare failures – two machines, long runs, clear thresholds already catch issues; SPC and preventive maintenance are enough;
- no history, no labels – only weeks (not months) of historian data, scrap and rework reasons not logged; data curation cost is higher than pilot value right now;
- frequent product chaos – daily recipe and format changes with no standard work; the model will not generalize, stabilize the process first;
- deterministic safety required – interlocks, e-stops, burner management; these need hard rules on PLC, not ML;
- OT/IT plumbing missing – no path to write back to MES, CMMS, or andon; AI cannot change outcomes, build integration first;
- commissioning phase – mechanics still moving, sensors not calibrated; collect baseline, do not train models yet;
- basic losses unfixed – unlubricated chains, misaligned guides, obvious leaks; fix the basics before modeling;
- ultra-low-power edge – battery nodes cannot run inference without trade-offs; use gateway analytics or upgrade hardware;
- low scrap economics – pennies per defect, monthly scrap already under 0.5 percent; model ROI will not clear the bar.
C) Run a 1-Week Opportunity Scan (Fast Path)
Pin down a feasible, high-ROI pilot in 5 workdays.
Day 0 – 90-minute kickoff
People: line lead, maintenance, quality, process, OT/IT, safety, plant manager.
Output: top 5 pains with measurable wins (e.g., −20% unplanned downtime on Filler 3; +2 pp OEE on Line A; −40% changeover scrap on SKU family X; −15% peak kW in Oven 2). Agree on 8-12 week pilot horizon and budget guardrail.
Days 1-3 – Prove data & integration
Data reality check: historian tag list and sampling rates; PLC/drive fault codes; AOI/vision access; meter points; gap analysis (how many weeks of history?).
Labels/outcomes: scrap/rework codes, FPY by SKU, MTBF/MTTR, micro-stop log, andon events, quality holds. Are time stamps aligned?
Systems map: SCADA (e.g., Ignition/FactoryTalk), MES (Opcenter/Plex), ERP (SAP), CMMS (Maximo), QMS/LIMS if batch/process. Identify write-back points (andon, CMMS work order, MES alarm).
Constraints: safety and change-control, ISA-95/62443 network zones, on-prem vs. cloud policy, explainability needs (automotive IATF, food HACCP, pharma cGMP).
Days 4-5 – Pick one pilot and lock scope
Select one problem with a clear monetary impact and data ready now.
Draft a 1-pager:
- Problem & baseline: where it hurts (asset/line), current metric (e.g., OEE 62%, MTBF 19h, scrap 3.8%).
- Target win: specific lift (+2 pp OEE, −25% unplanned stops, −30% changeover scrap).
- AI approach: rules vs. classical ML (time-series/trees) vs. DL (vision).
- Deployment: edge gateway vs. cloud; trigger path (alert, andon, CMMS auto-ticket, setpoint suggestion).
- Integration: which systems read/write; security owner; change-control plan.
- Owner & cadence: named pilot owner, weekly 30-minute stand-up, success gate at week 4 and week 8.
- Go/No-Go criteria: data quality thresholds, early stop rule, ROI test (back-of-envelope: savings ≥ 3× pilot cost).
Aim: in one week, move from “we think AI could help” to one pilot with a baseline, target, data proof, and a clear path to impact-so you can start delivering results, not decks. If you want to know more about the costs behind AI system development, we encourage you to refer to our article: “How Much Does AI Development Cost in 2025? A Complete Breakdown”.
AIoT suitability self-assessment
Use this AIoT Suitability Self-Assessment to quickly gauge whether your organization is ready for an AIoT pilot. Download the checklist to score your current state and identify gaps before investing.
KPI Framework in Manufacturing
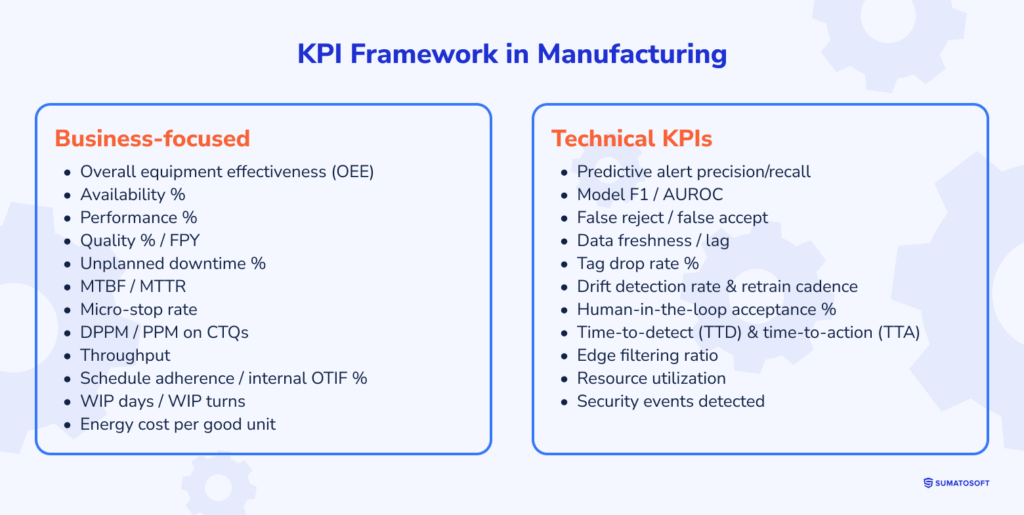
Measure outcomes, not models. This framework helps a manufacturing plant pick 5-7 metrics that prove AIoT moved the needle on production and cost.
We map business KPIs to common cases like predictive maintenance (OEE, MTBF/MTTR, unplanned downtime), inline vision QA (first-pass yield, scrap, escapes/false accepts), energy optimization (kWh per unit, peak demand), and flow tuning (throughput, cycle time).
Then we pair them with technical KPIs like precision/recall, false-alert rate, edge/cloud decision latency, and service/data uptime, so operations can trust the system.
You’ll set a clean pre-pilot baseline, a target delta, owners, and a weekly read-out that rolls up to finance, turning a pilot into numbers your CFO will sign.
Business-focused KPIs
- Overall equipment effectiveness (operations & throughput) – your primary “one number” for line health:
- Availability % (operations & throughput) – isolate unplanned vs. planned loss:
- Performance % (operations & throughput) – shows speed loss:
- Quality % / FPY (quality & yield) – first-time-right:
- Unplanned downtime % (reliability & maintenance):
- MTBF / MTTR (reliability & maintenance):
- Micro-stop rate (operations & throughput) – the hidden OEE killer:
- DPPM / PPM on CTQs (quality & yield):
- Throughput (operations & throughput) – tie to plan vs. actual:
- Schedule adherence / internal OTIF % (flow & supply):
- WIP days / WIP turns (flow & inventory):
- Energy cost per good unit (energy & utilities):
Technical KPIs
- predictive alert precision/recall (maintenance program effectiveness) – true-positive quality and coverage vs. CMMS truth;
- model F1 / AUROC (model performance) – balanced accuracy on the target (defect/failure/jam);
- false reject / false accept (vision quality control) – over-rejects vs. escapes on AOI/vision;
- data freshness/lag (data pipeline health) – seconds from PLC/tag to feature store/inference;
- tag drop rate % (data pipeline health) – missing samples on critical sensors;
- drift detection rate & retrain cadence (model lifecycle) – data/concept drift flags per month; days between retrains;
- human-in-the-loop acceptance % (change management) – operator/engineer accepts vs. overrides;
- time-to-detect (TTD) & time-to-action (TTA) (operational response) – alert – acknowledgment – corrective action;
- edge filtering ratio (cost efficiency) – raw – filtered data volume; bandwidth/cloud € saved;
- resource utilization (runtime efficiency) – CPU/GPU/Memory at the edge and in the cloud during peak;
- security events detected (security & compliance) – anomalous device/network behaviors flagged and resolved.
Calculating Cost Vs. Benefit (With an Example)
Here’s the fast, CFO-proof way to price an AIoT pilot in manufacturing. We’ll convert improvements into money-downtime minutes avoided × cost/min, scrap cut × value/unit, kWh saved × tariff, plus maintenance and capacity gains, then stack them against one-time (integration, sensors/gateways) and monthly costs (licenses, cloud, support).
You’ll see a single worked example with baselines, assumptions, and a simple payback + ROI calculation, plus a quick sensitivity check to show best/worst cases.
Step 1 – Context & Baseline (12 months)
Line & constraint: tier-1 automotive stamping + spot-weld cell. Press #3 (600-ton) is the bottleneck.
Scope: (1) Inline vision QA for surface defects + die protection; (2) Predictive maintenance on press main bearings/drive.
Stack: 6 line-side cameras – Edge IPC (inference) – Allen-Bradley ControlLogix (EtherNet/IP) – Ignition via OPC UA; model ops in private cloud.
Owners. Maintenance Supervisor (PdM), Quality Engineer (vision), Controls Engineer (PLC), IT/OT lead.
Baseline metrics:
- OEE – 68% = availability 82%, performance 90%, quality 92%;
- unplanned downtime – 180 h/yr on Press #3;
- micro-stops / rate loss – 1.5%;
- scrap – 4.5% on 1,000,000 parts/yr = 45,000 scrapped;
- customer escapes – 1,500 PPM; $180k/yr chargebacks;
- energy – $242k/yr (press + weld cell) + $45k/yr demand charges;
- line rate & margin – 600 parts/h at the constraint; $12 contribution margin/part;
- inspection labor – 3 shifts; ~1 FTE can be reallocated if vision is stable.
Step 2 – Targets, Acceptance Criteria & Equations
Targets (what “good” looks like):
- availability – minus 30% unplanned downtime via PdM (alert recall ≥ 0.85, precision ≥ 0.60);
- performance – minus 1.0 pp micro-stops (stable reject divert to rework chute; no starve/blocked);
- quality – scrap 4.5%; false reject ≤ 2% at ≥ 60 fps; decision latency ≤ 80 ms part-to-divert;
- customer – PPM 1,500-500 within 6 months.
Equations (finance-ready):
-
Downtime value:
-
Performance (micro-stops) –
-
Scrap reduction –
-
Chargebacks / PPM –
-
Energy –
-
Labor reallocation –
Step 3 – Calculations & Result
Benefits (annual, pre-risk):
- Downtime:
- Performance (micro-stops):
- Scrap:
- Chargebacks:
- Energy:
- Labor:
Gross benefits: $868,800
Risk-adjusted (α = 0.75): $651,600
Costs:
- one-time (K) – cameras/lenses/lights $33k; edge IPCs $14k; sensors $4k; install & PLC changes $95k; labeling & model development $90k; integration & testing $52k; training $12k – total $300,000;
- ongoing (O) – MLOps, support, model refresh, spares – $85,000/yr.
Result:
- net year-1 – $651,600 − 85,000 = $566,600;
- payback – $300,000 ÷ $566,600 ≈ 0.53 years (~6.3 months);
- NPV (4 years @ 10%) – $566,600 × 3.169 − 300,000 ≈ $1.50M.
How to use it
- map to OEE – show which lever moves availability, performance, or quality and by how much; report weekly in that format;
- price downtime right – use rate × contribution margin, not overhead allocations; finance will accept it;
- keep α conservative – start at 0.6–0.8 until you have 8–12 weeks of live data; raise later;
- lock acceptance criteria – QE signs false-reject and latency; Maintenance signs PdM recall/precision;
- name owners + stack – put the Controls/SCADA/PLC path on the one-pager so the model can change the line day one;
- sanity checks – if the constraint moves, re-price benefits; if PPM/chargebacks dominate, weight that lever higher.
What’s Next?
The information above is enough to calculate, plan, and deploy the full-fledged AIoT system. Pick one line and its bottleneck, freeze an 8-12-week baseline, set a single money target, and name an owner. This week, validate data/labels/write-back, lock 5-7 business KPIs plus essentials, and draft a one-pager with week-4 and week-8 go/no-go and a weekly finance read-out. Over the next 8-12 weeks, plumb the data, ship a thin vertical slice-inference – alert – action on HMI/andon/CMMS-track TTD/TTA and operator acceptance/overrides.
If you plan to develop your own AIoT system for manufacturing, we encourage you to reach out to us at SumatoSoft. We specialize in IoT development.
How We Can Help
SumatoSoft builds AI-ready IoT for manufacturing: we connect sensors and PLCs, run ML at the edge or in the cloud, and wire results back into production so OEE goes up and waste goes down. We’re ISO 27001-certified, 70% of our team are senior engineers, and we’ve delivered IoT software for brands like Toyota, Dexai, and Beiersdorf.
What we do:
- data capture & device integration – connect sensors, cameras, and gateways; ingest PLC/industrial data securely; stream to AWS IoT / Azure IoT / GCP; normalize for analysis;
- edge & vision ML – inline defect detection with feedback to PLCs (divert/stop), die-protection, presence checks; choose edge vs. cloud to meet latency;
- predictive maintenance & time-series analytics – vibration/temperature models for failure prediction, anomaly detection, and RUL; integrate alerts with maintenance workflows;
- dashboards & remote apps – OEE, SPC, energy and PPM dashboards; role-based web/mobile apps for operators, QE, and maintenance; safe remote control where needed;
- security, QA, and compliance – ISO 27001 practices, GDPR-aligned data handling, secure coding (OWASP), rigorous testing before release;
- operations, updates, and support – proactive monitoring, model/data refresh, OTA updates, and long-term application support.
How we engage (fast path):
- opportunity scan (1 week) – cross-functional workshop; pick 1–2 high-ROI cases; define data sources, constraints, and acceptance criteria (e.g., false rejects, latency, PdM alert quality); one-page pilot plan with baseline and target impact on availability, performance, and quality;
- pilot (30–90 days) – implement data pipeline, build models (rules/ML/CV), integrate with your stack, and run on real production; weekly read-outs on OEE, scrap, and downtime;
- scale-up – harden security and reliability, add OTA/device management, extend to more lines/plants, and integrate with ERP/CRM and other core systems.
Let’s talk. Share your line constraints and we’ll map a pilot that pays back quickly – then help you scale it.
Let’s start
If you have any questions, email us info@sumatosoft.com


