AIoT in Agriculture: Real Cases, ROI, and a Pilot Playbook


AIoT delivers on the farm when it lifts yields while shrinking water, fertilizer, fuel, and labor per hectare.
Networked soil-moisture probes and weather stations, camera traps, drones and satellite imagery, variable-rate implements, and much more.
This article continues our cross-industry AIoT series-after manufacturing and healthcare, we turn to agriculture. We’ll map what to automate across crop, livestock, and storage operations, examine how to measure ROI, and show how to prove value fast.
Expect recent, real-world cases with hard numbers, a KPI framework, and a copy-paste cost-vs-benefit example you can adapt to a farm, co-op, or ag-retailer.
No fluff, no vendor pitch-just steps, numbers, and patterns you can apply from one of the top Internet of Things software development companies.
The Wave of Innovation – How AI-Powered IoT Looks in Agriculture
Case 1: John Deere “See & Spray” (University of Arkansas) – Row-Crop Herbicide Management
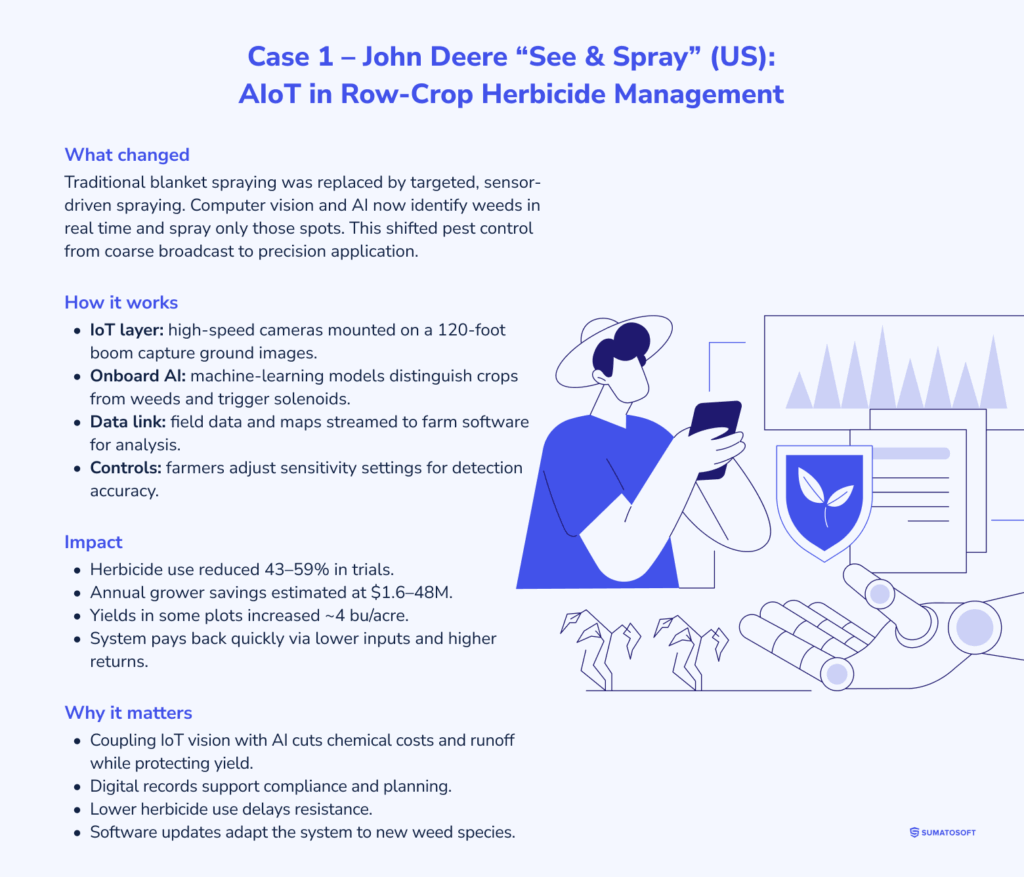
What changed: Traditional blanket spraying of entire fields was replaced by targeted, sensor-driven spraying. Instead of broadcasting herbicide over all crops, the See & Spray system uses computer vision and AI to identify weeds in real time and spray only those spots. This shifts pest control from coarse to precision application.
How It works: The system mounts high-speed cameras along a 120-foot boom on the sprayer. Cameras continuously image the ground; onboard AI (originally developed by Blue River Technology, now part of John Deere) processes each frame to distinguish crop plants from weeds.
Machine-learning vision models run on the tractor’s computer and trigger solenoids to spray herbicide only where weeds are detected. Field data and application maps are recorded in real time (an IoT link from the tractor to farm software). Farmers can also adjust sensitivity settings for detection. In research trials, the cameras + AI accurately identified and sprayed weeds in soybean/cotton fields without human intervention.
Impact: Over three years of trials in Arkansas soybeans, See & Spray cut post-emergence herbicide use by roughly half. Compared to conventional broadcast spraying, targeted spraying reduced chemical use 43-59%. In one test, lowering the detection sensitivity saved millions in herbicide – researchers estimated Arkansas growers could save $1.6-48 million per year (13-80% cost reduction) on post-emergence herbicide.
Even at conservative use, weeds missed were small; in some plots the yield was actually higher by about 4 bu/acre (likely from less crop injury). Overall this ROI meant the system paid for itself quickly by slashing input costs and improving net returns.
Why It Pays Off: By coupling IoT vision (high-resolution cameras) with AI weed-recognition models, farmers spray far less herbicide – cutting input costs and chemical runoff without hurting yields. The sensor data and geotagged spray records provide a digital audit trail for compliance and planning.
Beyond cost savings, the system delays resistance by using less total pesticide, and it can quickly adapt (via software updates) to new weed species. In summary, See & Spray’s AIoT stack (camera sensors + machine learning) provides immediate labor and chemical savings and a fast ROI – essentially “less spent, more saved” in precision agriculture.
Case 2: MyAnIML – AI-Driven Cattle Health Monitoring (USDA Collaborative Study)
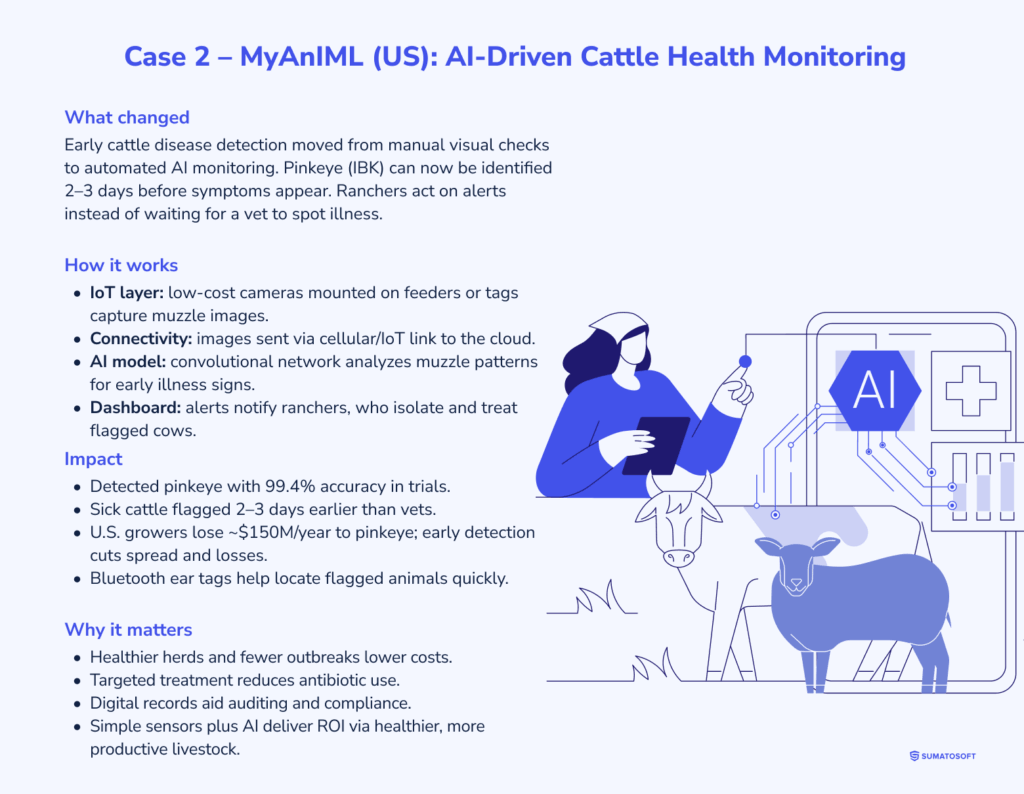
What Changed: Early disease detection in cattle shifted from labor-intensive visual checks to automated monitoring. Cows that develop pinkeye (IBK) can be identified days before symptoms appear. Instead of waiting for a vet to spot illness, ranchers use continuous imaging and AI analysis to flag animals pre-symptomatically.
How It Works: Low-cost cameras (GoPro-style) are mounted on cattle feeders or tags. Every time a cow comes to feed, its muzzle is imaged. These images are sent over a cellular/IoT link to a cloud platform. MyAnIML’s AI (deep convolutional network) analyzes the muzzle “dermatoglyphics” – unique texture patterns of each cow’s nose – looking for subtle changes that precede illness. The models were trained on thousands of annotated cattle muzzle images. In practice, each camera image is processed through the facial-recognition algorithm in seconds, and the system flags any individual whose muzzle pattern suggests disease. Ranchers receive alerts and can isolate those cows for treatment. The entire pipeline (camera, connectivity, AI model, dashboard) was developed jointly by MyAnIML and USDA researchers.
Impact: In trials on 870 beef cattle across three Kansas ranches (summer 2021-22), MyAnIML’s system detected bovine pinkeye with 99.4% accuracy, several days before a veterinarian could see symptoms. In other words, sick animals were flagged ~2-3 days earlier than standard methods. Catching pinkeye early means infections are treated before they spread – in the U.S., pinkeye costs growers ~$150 million/year in lost performance and treatment. By alerting farmers days ahead, the AIoT solution can cut infection rates dramatically (though exact herd-level savings are proprietary). Notably, MyAnIML also released “smart” ear tags with Bluetooth so staff can quickly locate flagged animals in large herds.
Why It Pays Off: The AIoT approach pays via healthier herds and lower losses. Early detection lets ranchers isolate sick cattle immediately, reducing outbreaks and the heavy costs of widespread infection. The system’s digital records also aid in auditing animal health. Perhaps most importantly, early flagging avoids overuse of antibiotics (treating only affected individuals rather than prophylactic dosing), which saves on medication and helps steward antibiotic effectiveness. In summary, MyAnIML’s AI-enabled IoT monitoring delivers a new kind of ROI in livestock: fewer sick cows, reduced treatment costs, and minimal production losses – all by harnessing simple sensors plus AI pattern recognition.
Where AIoT Pays Off in U.S. Agriculture
On modern farms, AIoT ties soil-moisture probes, weather stations, GPS-guided tractors, and drone imagery to models that act on the data in real time. Computer vision spots crop stress, weeds, and disease; ML predicts yield and optimal input levels; reinforcement learning and autonomy steer sprayers and robots plant-by-plant.
The payoff is operational and financial. The table below summarizes where these gains from integrating AI into businesses come from, which AI methods drive them, and what to expect on ROI.
| Item | Description |
|---|---|
| AIoT usage | The implementation of IoT sensors (soil moisture probes, weather stations, GPS-equipped tractors, drones) and AI analytics in smart farming (precision agriculture) enables the optimization of crop production. The systems gather precise information about field conditions and crop health, through which AI models generate recommendations or execute automated actions such as precise irrigation control based on soil conditions and drone-based computer vision for plant-by-plant pest and nutrient detection. |
| AI methods | Computer vision (using CNNs on images from drones or cameras) identifies crop stress, weeds, or disease. Machine learning regression models predict yields and ideal input levels (fertilizer, water) based on sensor data and weather forecasts. Reinforcement learning can drive autonomous farm vehicles or robotic weeders. Many precision agriculture systems use unsupervised learning for anomaly detection in sensor readings and AI-driven decision support to tell farmers when to irrigate, fertilize, or harvest for maximum ROI. |
| ROI impact | AIoT in agriculture boosts output and cuts costs. U.S. farms adopting precision tech have seen 10-30% increases in crop yields by applying water and inputs more precisely. At the same time, input costs drop – for example, 15% lower input costs on average due to avoiding over-application. Smart irrigation guided by AI can reduce water usage by ~25% while still improving yield, a huge saving in water-scarce regions. These efficiency gains translate to higher profit margins, as farmers achieve the same yields with fewer inputs, directly raising profit per acre. |
| U.S. example | John Deere’s “See & Spray” system exemplifies AIoT in farming. It mounts cameras and computer vision AI on sprayers to distinguish weeds from crops in real time. The machine learning model triggers spray nozzles only on detected weeds, rather than blanket-spraying the whole field. This innovation led to an average 77% reduction in herbicide use (and up to ~90% in some trials) while still eliminating 98% of weeds – matching the efficacy of traditional full-field spraying but with a fraction of the chemicals. Many U.S. corn and soybean farmers also leverage precision planting AI to boost yields by around 30%. |
Building the Next Successful AIoT Case in Agriculture
This section turns “AIoT in agriculture” from an idea to a pilot you can ship this season. We focus on real pains-over-irrigation/under-irrigation, high herbicide spend, surprise disease, storage spoilage, late livestock illness-and show when AI adds lift beyond rules. Then we cut what won’t pay off yet (no actuation, thin data, bad connectivity), so you don’t waste time or budget. Finally, you’ll run a 1-week opportunity scan: validate signals and outcomes, confirm integrations (pivots, sprayers, bins, tags), flag constraints (water rights, labels, safety), and pick one high-ROI pilot with a named owner, clear deployment (edge/cloud), and 2-3 KPIs tied to dollars per acre.
Is AI in IoT Right for You
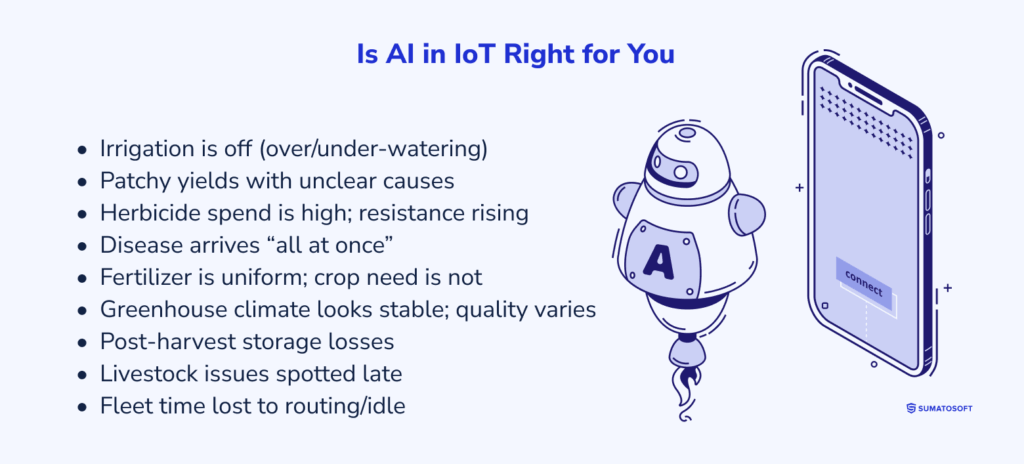
- irrigation is off (over/under-watering) – IoT: zonal soil-moisture, flow meters, pivot logs, in-field weather (ET, wind, temp), canopy temp. AI: zone scheduling, leak detection, auto setpoints to VWC/ET; water down with yield intact.
- patchy yields with unclear causes – IoT: multi-year yield maps, drone/satellite NDVI/thermal, soil EC/texture, planter logs, VRA records. AI: attribute drivers, micro-zone seed/N/K prescriptions, forecast lift next season.
- herbicide spend is high; resistance rising – IoT: boom cameras, smart nozzles, weed-scouting cams, sprayer telematics, wind/drift sensors, spray logs. AI: real-time weed ID + spot-spray, drift-aware windows, track savings ($/acre, % chemistry reduced).
- disease arrives “all at once” – IoT: canopy/leaf cameras, spore traps, microclimate (leaf wetness, RH, temp), scouting apps. AI: early-warning risk by block/row, target fungicides, fewer spray passes with quality preserved.
- fertilizer is uniform; crop need is not – IoT: soil nitrate/EC, tissue tests, weather + growth stage, VRA controllers. AI: dynamic N models per zone, VRA rates, cut lbs/acre with higher protein/grade.
- greenhouse climate looks stable; quality varies – IoT: CO₂/PAR/temp/humidity, VPD, drip flow, root-zone EC/pH, climate PLCs. AI: optimize light, VPD, fertigation per cultivar; better grade-out and time-to-harvest.
- post-harvest storage losses – IoT: bin temp/RH/CO₂, fan/VFD, load-cell logs. AI: predict hotspots, automate aeration; cut shrink, spoilage, and fan energy.
- livestock issues spotted late – IoT: ear tags/RTLS, rumen boluses, pen cameras, waterer counts, scales. AI: detect illness from behavior; target treatment; protect ADG and reduce mortality.
- fleet time lost to routing/idle – IoT: telematics (CAN/ISOBUS), fuel meters, geofences. AI: optimize routes and field sequences; reduce idle/fuel; tighten pass-to-pass timing.
B) When AI Is Overkill (For Now)

- no actuation – without VRA/section control, insights can’t move inputs.
- thin data history – weeks of moisture/yield/imagery and few outcomes (weights, quality, pests) won’t generalize; use rules/agronomist heuristics.
- uniform, small context – one soil, rain-fed, stable yields, low pests; threshold timers/playbooks suffice.
- unreliable connectivity – if LTE/LoRa drops and data can’t sync before decisions, AI arrives late.
- regulatory ceilings – label timing/drift rules cap savings; compliance first, optimization later.
- seasonal window too short – need value in weeks but cycle is annual; start with expert rules.
- tiny power budget – battery traps/pods can’t run CV/ML at edge; duty cycling causes misses.
- no clear owner – if no one will change setpoints, routes, or chemistry, insights die in dashboards.
C) Run a 1-Week Opportunity Scan (Fast Path)
Day 0 (90 min) – Frame pains and wins. Participants: farm manager, agronomist, irrigation lead, ops/equipment, IT/OT, compliance. Pick the top three pains (over/under-irrigation, herbicide spend, disease, N waste, storage spoilage, late livestock illness, fleet idle). Define numeric wins: water -20-30% acre-inches; chemistry -40-70%; yield/quality +5-10%; operations -15% idle/fuel and -1 spray pass per block. Select one concrete scope (e.g., pivots on Field 12, sprayer on soy, or a single grain bin).
Days 1-3 – Data + integration check (prove we can act). Verify signals and history exist, not just sensors. For crops: soil moisture by depth, weather/ET, imagery, ≥3 years yield maps, application logs, soil EC, tissue tests. For livestock: RTLS/tag pings, temperature/rumen, camera clips, feed and water counts, health events. Collect outcomes/labels that close the loop: harvest weights/quality by block, disease timing/location, weed counts and efficacy, utility bills, mortality/ADG, shrink/spoilage. Plan integrations to close the loop: ops APIs, irrigation controllers/VFDs, imagery pipelines, data bus/storage. Kill anything without history, integration, or an accountable owner.
Day 4 – Pick the pilot. Choose one feasible, high-ROI case with control authority (e.g., pivot VRA -25% water, spot-spray 600 acres -60% herbicide). Name the owner and decide edge vs cloud.
Day 5 – One-pager. Capture baseline and targets, data plan and labeling, AI approach (rules vs ML/CV), deployment with fail-safes, integrations and alert routing, risks/guardrails, plus a 30-90-day schedule with KPI readouts and go/no-go gates.
Outcome of the week: a scoped, defensible pilot you can ship in-season – with data paths, control hooks, an accountable owner, and 2-3 KPIs that tie directly to dollars per acre.
AIoT suitability self-assessment
Use this AIoT Suitability Self-Assessment to quickly gauge whether your organization is ready for an AIoT pilot. Download the checklist to score your current state and identify gaps before investing.
KPI Framework in Agriculture
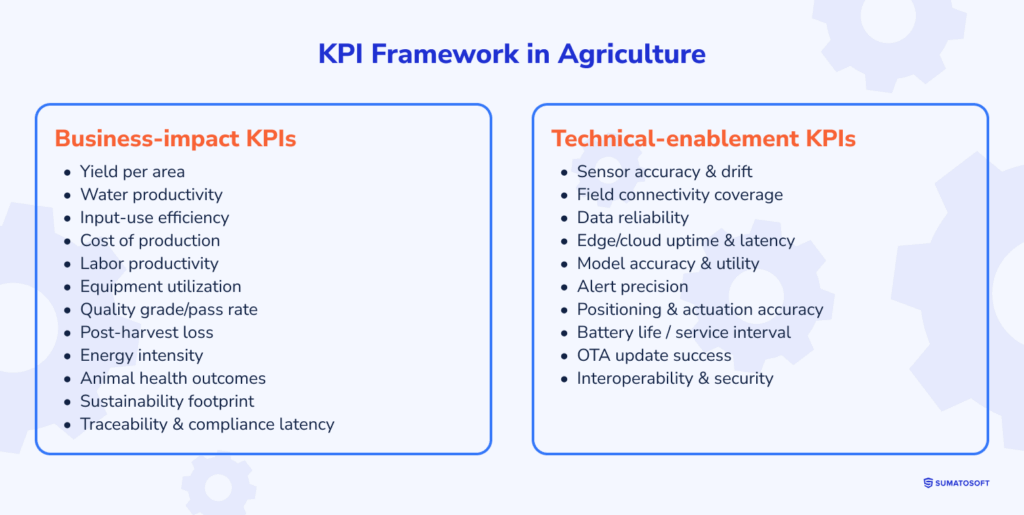
Great ag AIoT isn’t more sensors; it’s moving the numbers that matter. Below are KPIs farms use to prove value: business outcomes first, with technical enablers that keep gains repeatable.
Business-impact KPIs (P&L + ops):
- yield per area (t/ha, bu/acre) – AIoT (VRI/VRA + alerts) often delivers double-digit lifts.
- water productivity (kg or $ per m³) – precision irrigation cuts water ~30% at equal or higher yield.
- input-use efficiency (e.g., kg grain/kg N; kg fruit/L pesticide) – micro-zone timing/rates reduce waste and runoff.
- cost of production ($/t or $/cwt) – IoT-guided inputs/scheduling drop costs from ~$100 → ~$80/t in pilots.
- labor productivity (ha/FTE or animals/FTE) – automation/remote monitoring raise dairy ~70 → ~100 cows/FTE.
- equipment utilization (%) – connected dispatch + predictive maintenance lift utilization ~60% → ~90%.
- quality grade/pass rate (%) – vision + edge models cut defects and rework; more premium-spec lots.
- post-harvest loss (%) – bin/reefer sensors + alerts reduce spoilage and mycotoxin risk.
- energy intensity (kWh/t or L/ha) – route optimization, VFDs, load shifting trim fuel and electricity/unit.
- animal health outcomes – incidence (mastitis, lameness, BRD), SCC, FCR; wearables + anomaly detection catch issues early.
- sustainability footprint (kg CO₂e/t; N leaching; SOM) – track emissions, nutrient losses, soil organic matter across seasons.
- traceability & compliance latency – lot-level records in minutes, not days, via edge/cloud capture.
Technical-enablement KPIs (make gains repeatable):
- sensor accuracy & drift – e.g., soil moisture ±2% VWC; canopy temp ±0.5°C.
- field connectivity coverage (%) – usable signal across arable/grazing; mesh/gateways lift coverage ~75% → ~95%.
- data reliability (%) – successful readings ÷ attempted; target ≥97% even during storms/harvest peaks.
- edge/cloud uptime & latency – availability and time from observation to action; critical in-cab.
- model accuracy & utility – detection precision/recall/F1; regression MAPE/RMSE; aim disease ~95%, yield error ≈5%.
- alert precision (false-positive rate) – keep alerts actionable to avoid fatigue and eroded trust.
- positioning & actuation accuracy – RTK path error (cm), variable-rate application error (% of target).
- battery life / service interval – seasons between swaps (e.g., 1 → 2); track truck-rolls avoided.
- OTA update success (%) – firmware/model updates without bricking or downtime.
- interoperability & security – % devices on open protocols (ISOBUS/MQTT); patch latency; auth rate.
How to use:
Baseline each KPI, set a pilot “lift” (e.g., water +15%, loss -20%, alert precision >80%), align measurement to crop cycles or herd calendars. Report Business KPIs to sponsors. Keep Technical KPIs with the AIoT ops team to ensure repeatability at scale.
Calculating Cost Vs. Benefit (With an Example)
This is a worked, field-realistic example for a Midwest soybean operation. Clear math pattern, cost development breakdown, agriculture-specific drivers and ops details baked in.
Step 1 – Define the Variables
| Metric (what moves money) | Symbol | Unit | Inputs | Benefit formula |
|---|---|---|---|---|
| Herbicide saved via spot-spray | H$ | $/yr | Acres (A), baseline tank-mix cost per acre (Cherb), reduction rate (rh) from CV spot-spray | |
| Yield uplift (less crop injury, better timing) | Y$ | $/yr | Yield lift (Δy, bu/ac), crop price (P, $/bu), acres (A) | |
| Labor saved (fewer refills/passes) | L$ | $/yr | Hours saved (Hlab), loaded wage (W) | |
| Fuel saved (less idling/haul) | F$ | $/yr | Gallons saved (G), fuel price (Pf) | |
| Confidence factor after pilot | α | 0–1 | Apply conservatism to benefits | |
| Recurring opex (licenses/MLOps/support) | O | $/yr | Vendor quote | – |
| One-time costs (cameras, controllers, integration, training) | K | $ | Capex/enablement | – |
You can clone this structure for an irrigation pilot by swapping H$ for Water saved (acre-inches × $/acre-inch incl. energy), calculated as , and adding Pump energy saved (kWh × $/kWh), calculated as .
Step 2 – Core equations
- Annual benefits (risk-adjusted): Benefits =
-
Annual net cash inflow:
Net 1 - Payback (years):
- NPV over T years (discount r):
Step 3 – Worked example: Computer-Vision Spot-Spraying on 2,500 ac Soy
Scope & ops reality (this is where most vendors go vague – we won’t):
- equipment – 2 × 120-ft sprayers with PWM nozzles (ExactApply), 1,200-gal tanks, 12-14 mph at 15-20 GPA;
- crop & acres – 2,500 ac soy (central IL), post-emergence pass;
- baseline tank mix – $78/ac (glyphosate + PPO + NIS + AMS); water conditioning applied;
- CV hardware – boom-mounted cameras every 1.5 m; inference on the sprayer ECU at field speed; solenoid-level control;
- data & integration – ISOBUS control; as-applied maps written to John Deere Operations Center; offline-tolerant caching when LTE drops;
- compliance automation – system enforces farm-configured label rules – wind cut-off (e.g., 10-12 mph), 30-ft buffers auto-sectioned, crop/bee-safe windows respected;
- calibration & QC – weekly nozzle flow checks; daily camera self-test; paper/card deposition checks each field start;
- validation – 20 transects/field to measure weed escapes; control target ≤ 2 escapes/100 m; photo-logged;
- fallback & safety – one-tap full broadcast if CV confidence < 0.80, camera offline, or operator overrides; revert keeps maps and flags the interval;
- support – hotline during spray windows; 24-hour replacement kit for camera failures.
Inputs (one season):
- acres A – 2,500;
- baseline herbicide cost Cherb – $78/ac;
- reduction rate rh – 60% (mixed pressure; conservative);
- yield lift Δy – 0.8 bu/ac (less injury, better timing);
- soy price P – $12/bu;
- labor saved Hlab – 100 h, wage W = $35/h → L$ = $3,500;
- fuel saved G – 800 gal, Pf = $4/gal → F$ = $3,200;
- confidence factor α – 0.75 (post-pilot caution);
- recurring opex O – $35,000/yr;
- one-time costs K – $220,000.
Calculations:
- H$ = A · Cherb · rh = 2,500 · 78 · 0.60 = $117,000
- Y$ = A · Δy · P = 2,500 · 0.8 · 12 = $24,000
- L$ + F$ = $3,500 + $3,200 = $6,700
- Gross benefits = $117,000 + $24,000 + $6,700 = $147,700
- Risk-adjusted Benefits = α · Gross = 0.75 · 147,700 = $110,775
- Annual net (Net₁) = $110,775 – $35,000 = $75,775
- Payback = $220,000 / $75,775 ≈ 2.90 years
- NPV (T = 4 yrs, r = 10%) = -220,000 + 75,775 · (0.909+0.826+0.751+0.683) ≈ +$20,100
Sensitivity you’ll care about (two knobs that move everything):
- Pricier mix or higher pressure: if and , then → , , .
-
Lower pressure / cautious ops:
if
and
,
payback stretches to . Decide if chemistry prices or resistance risk justify the upgrade on your acres.
If you’re eyeing irrigation instead (quick swap):
- Replace H$ with Water saved = A · acre-inchessaved · ($/acre-inch incl. kWh).
- Add Pump energy saved = kWhsaved · $/kWh.
- Keep Y$ (often +3-7% from better timing).
- Same α, O, K, Payback, NPV structure.
- Ops specifics to lock: pivot/valve control (Valley/Lindsay/Netafim/Priva), ET/soil-moisture depths, water rights, buffer automation, and failover to manual setpoints.
What’s Next?
Start small, measure hard. Choose a single domain with fast payback-irrigation scheduling, disease/stress early-warning, grain-bin spoilage prevention, or dairy health/heat-stress alerts-and lock owners and budget. Baseline the KPIs you’ll move (e.g., yield/ha, water productivity, post-harvest loss %, labor productivity, SCC/FCR).
Run a 60-90-day pilot tied to crop or herd calendars on one field/block/herd/bin. Track actions, inputs, downtime avoided, and all incremental costs; then prove value with KPI deltas and a simple $ translation (e.g., water productivity +15%, loss -20%, $/t down). If payback meets your threshold and operators actually use the alerts, plan scale.
If you plan to develop your own AIoT agriculture system, we encourage you to contact us at SumatoSoft. We are IoT experts with deep specialization and can help you.
How We Can Help
Since 2012, SumatoSoft has delivered 250+ custom software products for Clients across 25+ countries (logos include Toyota, Dexai, Beiersdorf). We’re ISO 27001-certified (HIPAA/GDPR aware) and an AWS Partner specializing in custom IoT software development.
Practically, that means we don’t stop at dashboards: we design the full agricultural AIoT chain-from field devices (soil-moisture probes, weather stations, flow meters, rumination/heat tags, bin sensors, machine telematics) through ingestion and processing (MQTT/HTTP, stream filters, validation), into cloud and edge models, and back to action (irrigation setpoints, spray/route recommendations, grain-bin alerts) with OTA updates, fleet provisioning, and device troubleshooting built in.
Our team (≈70% senior engineers) ships quickly-we start the next business day in 95% of cases, run biweekly demos, and typically land a usable MVP within ~6 months. All these are using flexible engagement models that we apply depending on your project needs!
We align deliverables to the KPI framework you care about-yield/ha, water productivity, post-harvest loss, labor and equipment utilization, alert precision-and structure 60-90-day pilots that stand up in the field, not just in slides. If you want an implementation plan on your fields, we’ll review your context and propose a pilot within 1 business day.
Book a free consultation, and we will provide a discovery session to assess the cost of your project development.
Let’s start
If you have any questions, email us info@sumatosoft.com

