Research: Practical Framework for Quantifying IoT Return on Investment (ROI)
Abstract
Since its inception in 1990, the Internet of Things (IoT) has evolved from a showcase for prototypes to a working tool, delivering measurable results across industries such as manufacturing, logistics, building management, healthcare, city services, and field service. Instead of manual checks, companies receive a continuous picture of what’s happening: equipment warns of malfunctions in advance, fleets operate based on actual performance rather than guesswork, warehouses monitor assets in real time, and facilities monitor energy efficiency and regulatory compliance. The result includes fewer accidents and fines, fewer fires and repeat visits, higher quality, and increased customer trust.
To understand where investments are being returned and how, we surveyed executives who personally launched or sponsored IoT implementations over the past three years. The final dataset included only responses with specific, measurable results and a clear description of the application area. The picture was pragmatic and encouraging. The typical payback period is approximately 12 months. See also how to calculate the ROI of custom software development. At the same time, projects aimed at apparent cost reduction (for example, infection prevention in healthcare facilities or on-site quality control) often break even within 4-9 months. The most sustainable improvements reported by participants included fewer complaints and emergency calls (an average reduction of almost two-thirds), faster response and repairs (approximately 40%), less unplanned downtime (approximately 28-35%), and reduced energy and consumable consumption (approximately 20%). Respondents also noted intangible but essential benefits: transparency for audits and customers, increased team confidence, and a shift from “firefighting” to planned work.
The study also notes that key implementation success factors included integrating IoT data into established workflows and systems, clear change management with local “champions” at sites, and visible management support. The most significant barriers are resistance to new practices, integration with legacy systems, and connectivity issues. This report provides executives with a clear, uncluttered picture of where to start, what results are realistic to expect, and what to consider within the organization to ensure a rapid and predictable return on investment in IoT.
What Is IoT (Internet of Things)
The Internet of Things (IoT) is a corporate network that connects a company’s physical assets (equipment, vehicles, facilities, infrastructure) to operational processes via sensors and secure communications. Data from these assets is transformed into understandable events and actions within familiar systems and procedures (see our page about design and development of big data & IoT solutions). The goal is to reduce costs and risks, improve service availability and quality, and speed up decision-making. For current adoption patterns, see top trends in IoT development for 2025.
Business Value
- Operational efficiency, meaning less unplanned downtime, fewer emergency response calls, optimal routes and shifts, and predictable work schedules.
- Cost management involves saving energy and consumables, reducing returns and warranty claims, and minimizing penalties under service level agreements (SLAs).
- Quality and transparency in confirming work completion and compliance with procedures, based on objective data, as well as preparedness for audits and inspections.
- Security and compliance involve real-time monitoring of critical parameters and incidents, and evidence-based reporting.
- Revenue and customer experience include service stability, fewer customer-side outages, and new telemetry-based service offerings.
What Constitutes an Enterprise IoT Solution?
- Sensor and device layer. Data sources include equipment status, vibration, temperature, location, resource consumption, and asset presence or movement.
- Communication and gateways. Reliable data transmission, local noise filtering at the network edge, and buffering in case of signal loss.
- Data platform. Stream ingestion and storage, event and alert rules, asset digital twin management, and basic analytics scenarios.
- Integrations with key systems delivered as part of IoT software development services. Enterprise resource planning (ERP), maintenance management (CMMS), building management systems (BMS), dispatching, warehouse, and transportation logistics.
- Application scenarios and procedures. Pre-configured incident cards, approval routes, checklists, and instructions for staff.
- Security framework. Access control, minimal data collection, encryption, device and key management, and change tracking.
For planning and vendor-side discovery, consider IoT consulting services.
Key Findings from Our Study
Database: 36 verified case studies with quantitative results over the past 3 years (only responses with specific figures and a clear scope of application).
- The median payback period is 12 months (n=36).
- 72% of projects pay off in 12 months or less, and about a third in 9 months or less.
- The fastest payback occurs in the fields of medical (infection control) (see IoT development for healthcare) and construction quality inspections, often within ~4 months due to an apparent reduction in rework and incident response costs.
- The most drastic changes occur in complaints, lockouts, and emergency calls, with a decrease of approximately 67%.
- Key sources of savings include preventing downtime, reducing emergency calls and rework, achieving fuel and energy savings, lowering warranty costs and fines, minimizing wasted trips, and “empty” kilometers. Budgeting note: IoT development costs vary with device mix, integrations, and SLAs.
- The most helpful measure was found to be the integration of IoT signals into existing systems and processes (dispatching, maintenance, facility management).
- The most popular hindrance was resistance to new practices among local employees.
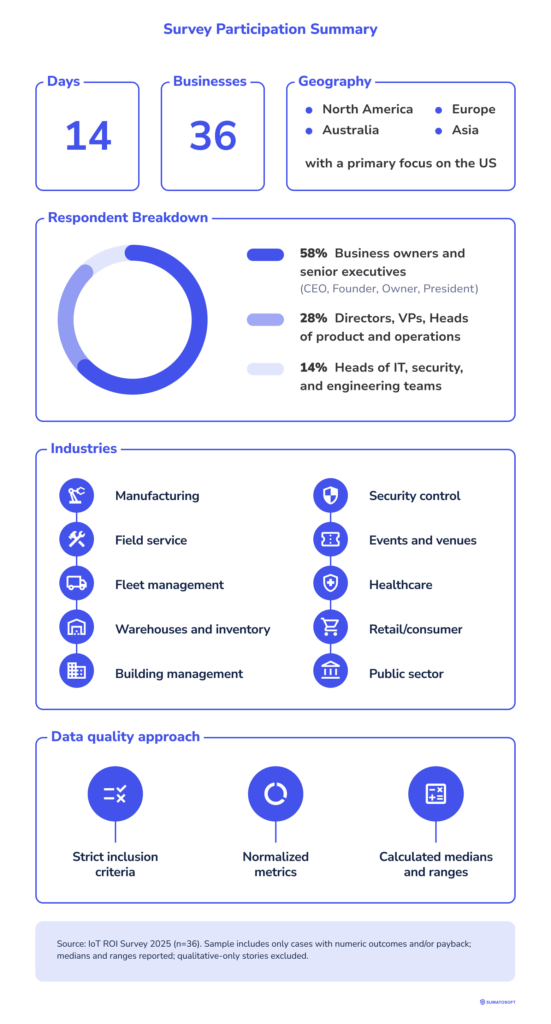
The survey window was 14 days and was conducted via Featured and HaB2BW. The number of participating companies exceeded 70; however, only 36 validated organizations were selected for quantifying results, as we only considered responses with precise figures on impact and payback period for inclusion in the analysis.
- Respondents:
- 58% were business owners and top executives (CEO, Founder, Owner, President);
- 28% were Directors/VPs/heads of product and operations functions;
- 14% were heads of IT/security/engineering teams.
- Geography: North America, Europe, Australia, Asia, with a primary focus on the US.
- Industries: manufacturing, field services, logistics and fleet, warehouses and inventory, facilities and HVAC, security and access, events, healthcare, retail and consumer, and public sector.
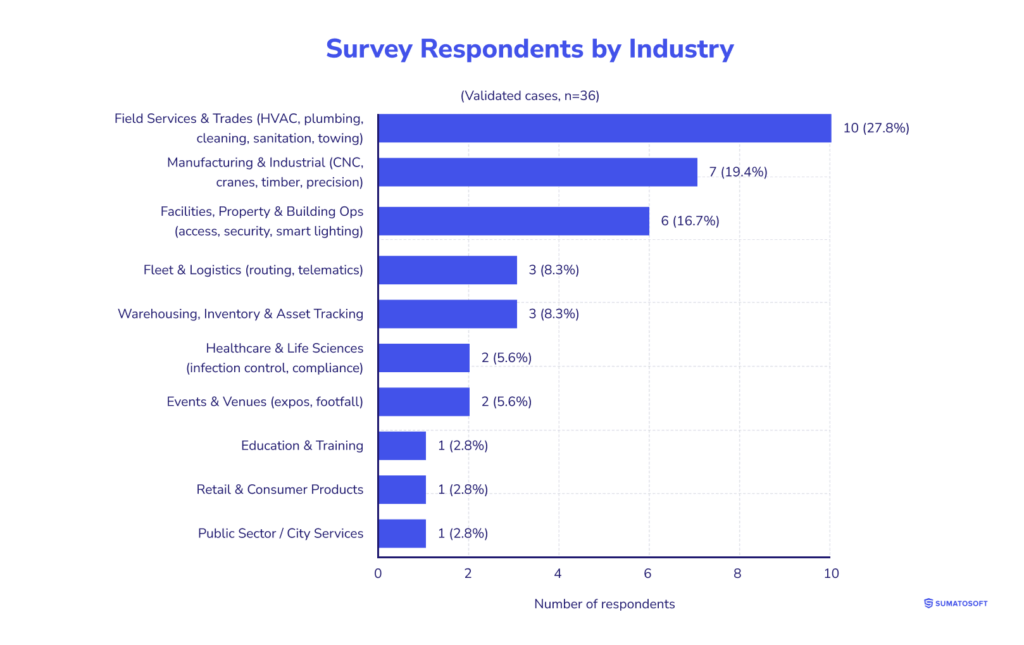
- Inclusion criteria: measurable results (payback percentage/months), clear application scenario, description of the baseline.
- Exclusion criteria: only “stories without numbers,” pure software telemetry without physical IoT, and context-free quotes.
- Calculation methods: median values and ranges; intangible effects are shown separately and not mixed with “hard” money.
- Limitations: self-reported data; figures vary by industry and maturity; conclusions are just guidelines.
Can a “Responsible” IoT Accelerate Business Resilience and Efficiency?
Operational disruptions, on-site skills shortages, rising costs, and process blind spots are common risks for many industries. When events unfold rapidly (accidents, demand surges, supply chain disruptions), the Internet of Things (IoT) enables companies to visualize the situation in real time and take proactive measures: predict failures, reduce emergency response times, save energy, and confirm compliance with customer and regulatory obligations. For sector examples, see IoT solutions for smart cities and top IoT devices transforming healthcare landscape in 2025.
To understand where and how these benefits arise, we interviewed executives who have personally launched or sponsored IoT projects over the past three years and were able to demonstrate quantitative results.
What Problems Do Companies Solve Using IoT?
According to managers’ responses, IoT was deployed in areas where money was being wasted and there was a lack of transparency in daily operations:
- maintenance: unscheduled downtime and breakdowns;
- field service and vehicle fleets (see IoT in logistics development): emergency calls, urgent tasks, delays, and empty runs;
- facilities: excessive energy and consumable consumption;
- asset tracking: warehouse losses and mis-sorting;
- safety/incidents: too many false alarms, slow response;
- quality and warranty claims: costly rework and claims;
- clients/audits: lack of “proof of work performed” and transparency.
Key Pain Points Before Implementation
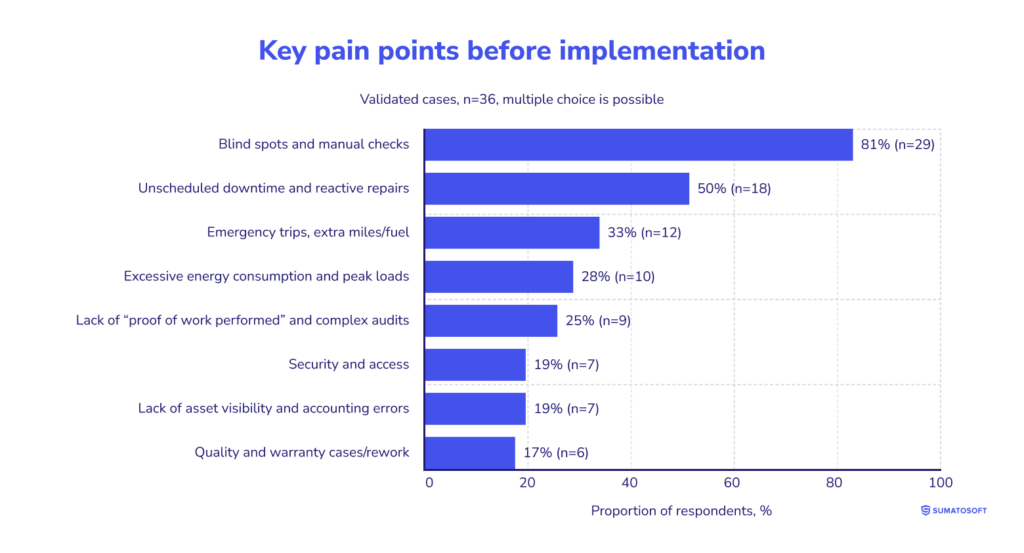
- Blind spots and manual checks (no real-time data, disjointed reports) — 29 out of 36 (81%).
- These pain points were manifested through late statuses, questionable facts of work performed, and decisions based on feelings.
- Unscheduled downtime and reactive repairs — 18 out of 36 (50%).
- These pain points were manifested through emergency stops, missed maintenance windows, and delayed production and service schedules.
- Emergency trips, extra miles/fuel (field work, fleet) — 12 out of 36 (33%).
- These pain points were manifested through slow response times, inaccurate ETAs, repeat customer calls, and inefficient routes.
- Excessive energy consumption and peak loads — 10 out of 36 (28%).
- These pain points were manifested through higher-than-normal bills, overheating/undercooling of areas, and a lack of accurate schedules.
- Lack of asset visibility and accounting/search errors (warehouse, inventory, equipment) — 7 out of 36 (19%).
- These pain points were manifested through lost/duplicate items, slow pick-and-pack, mis-sorting, and shipping errors.
- Security and access: False alarms, slow response — 7 out of 36 (19%).
- These pain points were manifested through on-call teams’ time wasted on “noise,” and incidents are closed late.
- Quality and warranty cases/rework — 6 out of 36 (17%).
- These pain points were manifested through complaints, rework, and quality penalties.
- Lack of “proof of work performed” and complex audits/SLAs — 9 out of 36 (25%).
- These pain points were manifested through disputes with clients, labor-intensive audit preparation, and poor traceability.
What Results Were Achieved, and Which KPIs Were Important
The reported improvements focus on four areas.
- Customer incidents and complaints are significantly reduced (often by half or more).
- Response and repair times are reduced by approximately one-third to one-half.
- Unscheduled downtime is steadily declining, which helps stabilize schedules.
- Energy and consumable consumption are reduced, especially with remote management and intelligent scheduling.
Additionally, in some cases, throughput/space utilization is increased, and defect and warranty rates are reduced.
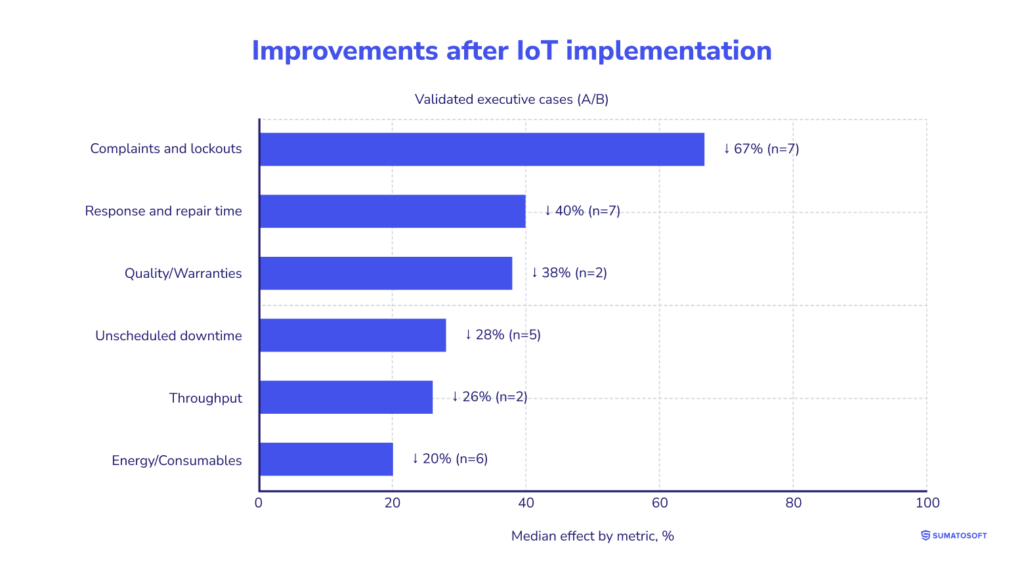
- Complaints/lockouts/emergency calls — median decrease is 67% (range -40% to -80%; n=7). Measurement methods include “Where is my technician/car” calls, help desk tickets, and insurance/incident records. Capital gains: fewer repeat calls and unscheduled work, lower customer compensation, and SLA penalties.
- Response and repair speed (time from incident to shutdown) — median decrease is 40% (-18% to -61%; n=7). Measurement methods include average response time and time to repair (in dispatch/maintenance logs). Capital gains: fewer overtime and night emergency shifts, higher utilization rates for shifts without incidents.
- Unplanned equipment/service downtime — median decrease is 28% (-20…-52%; n=5). Measurement methods include downtime hours, canceled shifts/slots, and lost output. Capital gains: prevented shutdowns, lower fines and revenue losses, and schedule alignment.
- Energy and consumables — median decrease is 20% (-9…-30%; n=6). Measurement methods include energy bills, kWh by zone, and service material consumption. Capital gains: reduced idle consumption and peaks, optimized HVAC/lighting modes, and fewer write-offs.
- Throughput/space utilization — median increase is 26% (+18…+34%; n=2). Measurement methods include service/pickup speed, zone, and flow route utilization. Capital gains: more processed orders/visitors in the same windows, higher revenue with the same infrastructure.
- Quality/warranty cases and rework — median decrease is 37.5% (-34…-41%; n=2). Measurement methods include the number of warranty claims and the share of rework due to quality checks. Capital gains: fewer returns and repairs, lower material costs, faster project closure.
What Changed After IoT Deployment
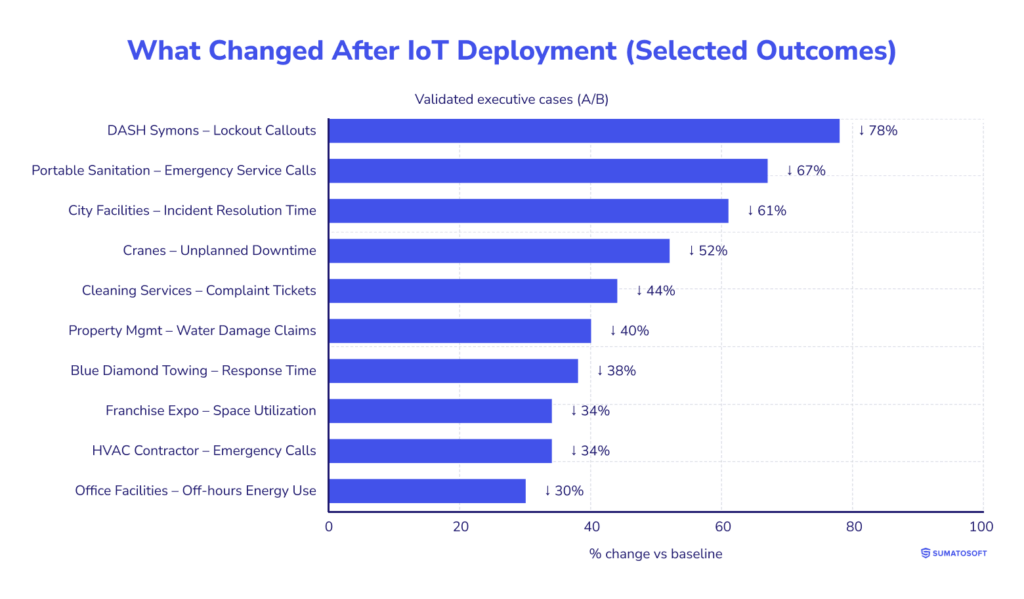
Since implementing IoT, companies describe a consistent pattern of change: from reactive to preventative work, from manual checks to verified data, from disparate systems to a unified workflow (signal → event → request → action → confirmation). This is reflected in specific business metrics, including fewer emergency calls and complaints, faster incident closure, reduced downtime, lower energy consumption, increased space utilization, and higher throughput.
- Public sector
- City facilities: incident resolution time went down 61% (18 → <7 minutes).
- What changed: incidents are closed faster, with fewer false alarms (an additional 45%), and staff see unified statuses.
- Why it’s critical to management: savings on on-call staff and contractors, higher facility availability, and reduced reputational risks.
- Building operations
- DASH Symons: lockout callouts went down 78%.
- What changed: residents no longer have to wait for key/card replacements, the company saves on emergency calls, and system uptime is 99.7%.
- Why it’s critical: direct operational savings + increased resident satisfaction; predictable SLA.
- Field services
- Portable sanitation: the number of emergency service calls went down 67%.
- What’s changed: level sensors and GPS automatically set tasks before overflow, and routes are optimized.
- Why it’s critical: fewer fires, savings on fuel and overtime, and more predictable schedules.
- Manufacturing and heavy equipment
- Cranes: unplanned downtime went down 52%; mean time to repair went down 35%.
- What’s changed: transition to condition-based maintenance, purchasing spare parts as needed (-22% spare parts inventory).
- Why it’s critical: high downtime costs; predictability reduces the risk of major project failures.
- Property management
- Water damage claims went down 40% (IoT leak detectors/smart meters).
- What’s changed: accidents are caught early, and insurers recognize active risk management.
- Why it’s critical: fewer claims and deductibles, property safety, and tenant confidence.
- Facilities and HVAC
- HVAC Contractor: emergency calls went down 34%; customer satisfaction score 7.2 → 9.1.
- What’s changed: proactive visits during business hours instead of late-night emergencies; customer energy savings of 15–23%.
- Why it’s critical: increased contract renewals, less overtime, higher service plan margins.
- Fleet and towing
- Blue Diamond: response time decreased by 38% (45 → 28 minutes), and “Where is my truck?” calls reduced by 78% (related metric).
- What’s changed: telematics and dispatching are now in a single stream, providing customers with accurate ETAs.
- Why it’s critical: fewer repeat calls and cancellations, fuel savings (-23% excess mileage), and quick payback.
- Facilities and cleaning
- Complaint tickets decreased by 44%, with SLA compliance improving by 19 points (additional metric).
- What changed: sensors (air quality, occupancy, equipment) are synchronized with cleaning plans, enabling “on demand” cleaning rather than scheduled cleaning.
- Why it’s critical: reduced SLA penalties and overtime, transparent proof of work performed.
- Small office and facilities
- Off-hours energy use went down 30% (smart locks/plugs/cameras/thermostats).
- What changed: automatic shutdown of “parasitic” loads, remote monitoring.
- Why it’s critical: quick return on investment without complex integrations; “peace of mind” as an intangible benefit.
- Events
- Franchise Expo: space utilization optimized by 34%; setup/breakdown time -2.3 hours/event (related metric).
- What’s changed: flow and occupancy sensors enable real-time zone relocation, speeding up setup/dismantling.
- Why it’s critical: higher revenue per square meter, higher exhibitor satisfaction, and increased booth extensions.
Executive Synthesis
The most repeatable result in service businesses and the municipal sector: faster response times and a reduction in emergencies (often -30% to -60%) due to routing and integrating IoT signals directly into ticketing systems.
The most predictable monetary effect in manufacturing and heavy equipment: -20% to -50% reduction in unplanned downtime through predictive maintenance.
Quick wins at facilities include achieving -15% to -30% energy savings and significantly reducing complaints when IoT data controls HVAC/lighting modes and confirms completed work.
Payback: Did the Project Pay Back, and When?
In the validated cases, the typical payback period is 12 months (median). 72% of projects pay back in 12 months or less, 36% in 9 months or less. Scenarios that directly reduce costs, such as emergency visits, downtime, warranty claims, and energy, have the fastest payback. Implementations with complex integrations and diverse legacy assets take the longest.
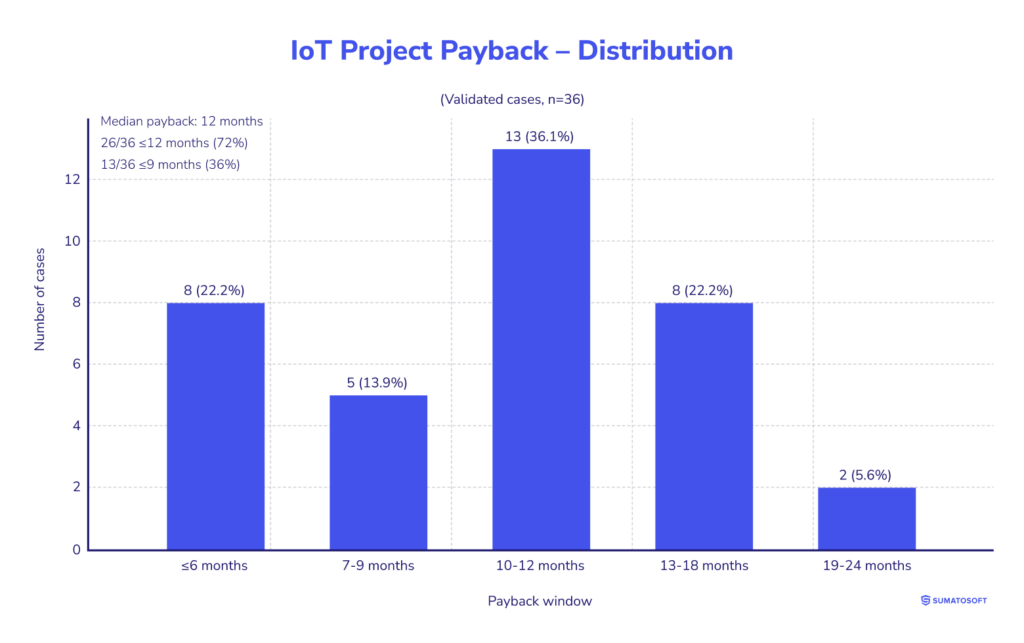
That is, for most companies, IoT isn’t a long story with an uncertain return, but a calendar year before payback, often faster.
Where do quick paybacks come from? Projects that directly “cut” operating costs pay for themselves the fastest, preventing emergency response and complaints, reducing unplanned downtime, energy, and consumables. These scenarios have a low integration threshold (sensor → event → request in an existing system), a clear connection to the P&L, and transparent recording of the effect in accounting data. This is why there are so many cases in the ≤12 months bucket.
When timelines stretch, the ranges of 13-18 and 19-24 months are typical for complex landscapes: multiple brands and generations of equipment, strict security and connectivity requirements, and distributed objects. Here, integration and standardization consume a significant portion of the budget. However, even such projects remain economically rational when they involve high downtime costs or penalties for SLA failure.
Biggest Non-Financial Gains
Money isn’t the only impact. Repeatable non-financial gains: trust and transparency for clients and auditors, predictability of work, and team confidence. These factors consistently support cost savings: fewer disputes, fewer urgencies, and higher quality.
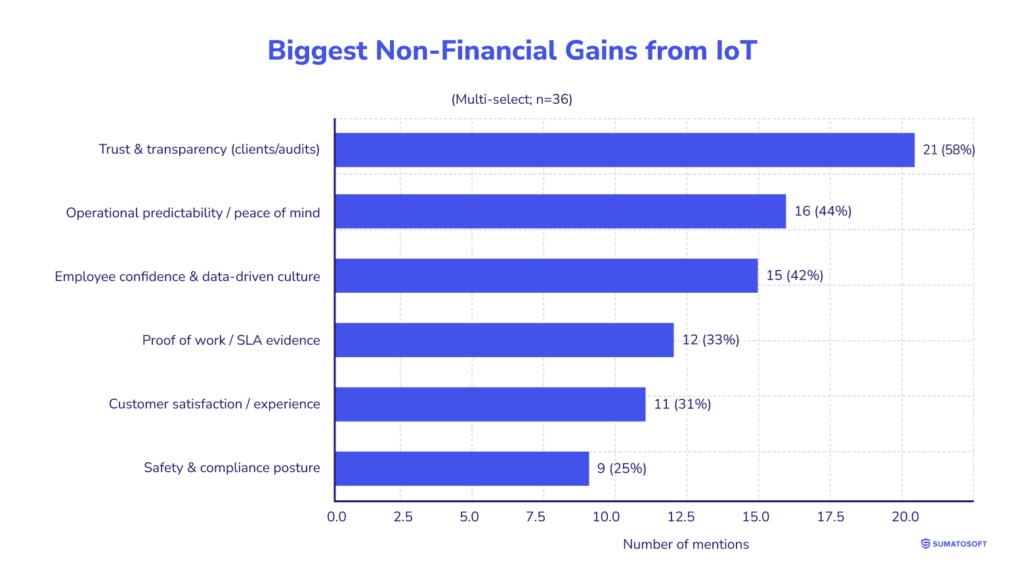
- Trust and transparency for clients/auditors — 58% (21/36).
- Key point: Unified event logs and confirmation of completed work eliminate disputes and speed up audits.
- Operational predictability — 44% (16/36).
- Key points include fewer unscheduled calls and “night” incidents, along with stable schedules.
- Staff confidence and execution discipline — 42% (15/36).
- Key point: Decisions are made based on data, which in turn improves compliance with regulations.
- SLA evidence base — 33% (12/36).
- Key point: Objective artifacts (geotagging, telemetry, photos/videos) are becoming the standard for calculations and claims processing.
- Customer experience — 31% (11/36).
- Key point: Accurate ETAs and transparent statuses increase satisfaction and contract renewals.
- Security and compliance position — 25% (9/36).
- Key point: Actual monitoring of conditions and actions reduces regulatory and insurance risks.
Top Enablers of Success
We asked executives to name the factors that transformed IoT from a pilot project into a sustainable operational result. Responses from various industries converged on one thing: the key to success is the operationalization of signals. The most frequently cited were:
- integration into existing processes and systems – 61% (22/36): automatic creation of requests and tasks in CMMS/ERP/dispatching;
- change management and local champions – 50% (18/36): training, simple response rules, on-site support;
- visible management support – 44% (16/36): clear goals, prioritizing loss elimination, reducing organizational friction. Second-tier: simple UX (red/yellow/green, mobile-first) — 33% (12/36), reliable integration partners — 28% (10/36), and edge noise filtering + the “minimal data” principle — 19% (7/36).
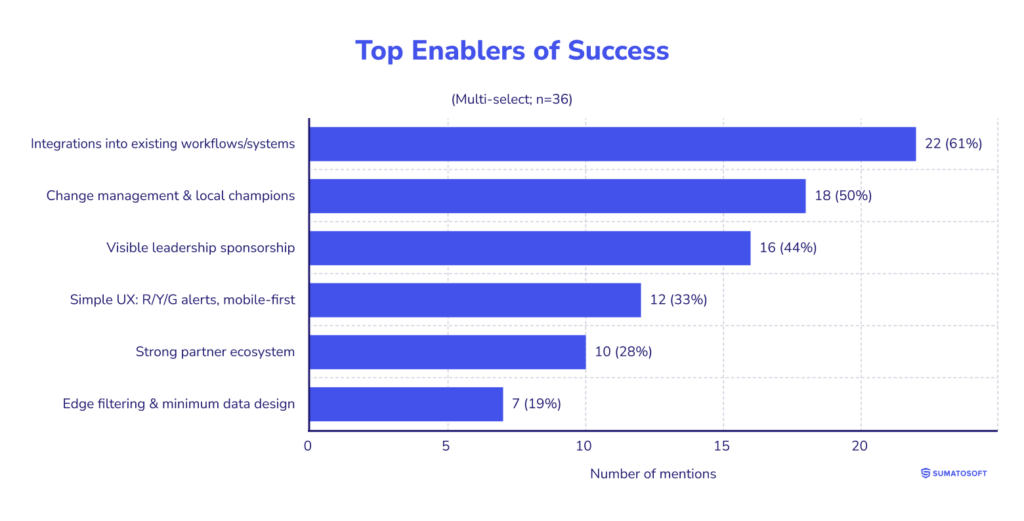
Successful implementations share a common logic: the IoT signal is immediately converted into action according to a known procedure and is delivered to the systems where teams are already deployed. What and who helped the surveyed companies to enable the success of IoT deployment:
- a plan for connecting to existing processes;
- a specific manager who is responsible for each target metric, with monthly reporting;
- R/Y/G scenarios on a single screen + mobile task cards; trained “champions” on-site;
- proven connectors/gateways for a wide range of equipment and protocols;
- filtering and aggregation at the edge that speed up responses and simplify security/compliance.
Top Barriers
Based on the combined responses, organizational and integration barriers are the primary ones. The most frequently cited barriers were resistance to change on the ground (20 out of 36, 56%), integration with legacy and heterogeneous equipment (18 out of 36, 50%), and connectivity and security limitations (14 out of 36, 39%). These three categories account for approximately 71% of all barrier mentions (in multiple-choice), reflecting the systemic nature of the barriers: human behavior and processes, heterogeneity of the equipment fleet, and network requirements and countermeasures.
Less frequent but consistent themes included data noise/signal quality (8 out of 36, 22%), privacy and compliance issues (7 out of 36, 19%), and stakeholder fatigue/coordination (6 out of 36, 17%). These barriers were encountered in cases involving distributed infrastructure, mixed vendor environments, and increased regulatory burdens.
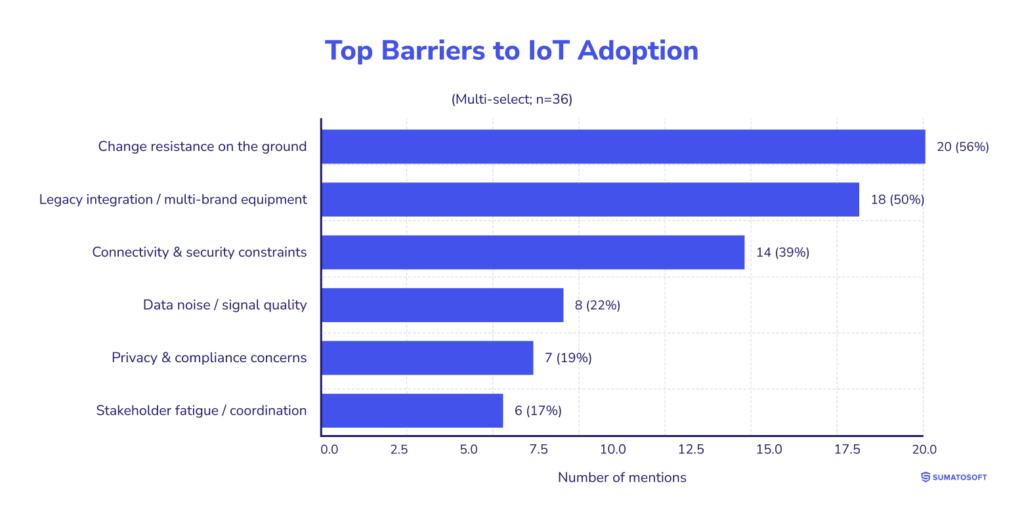
The barriers are primarily operational and architectural in nature, rather than technological: implementations are constrained by teams’ willingness to change practices, the need to “stitch” together generations and brands of equipment, and network/security limitations. Based on the responses, cases dominated by legacy and connectivity were more likely to have longer payback windows (13-24 months). In comparison, projects without these constraints had payback windows of up to 12 months. Taken together, the data suggest that scalability is more determined by process manageability and environment compatibility than by the mere presence of sensors and platforms.
Conclusion
Across validated, executive-led case studies, IoT has moved from promise to practice. The evidence is consistent and cross-industry: projects typically reach payback within a 12-month cycle (median), with 72% recovering investment in ≤12 months and 36% in ≤9 months. The fastest returns occur where telemetry removes visible waste, such as emergency callouts, unplanned downtime, rework, and excess energy, because savings are immediate and recorded in operational and financial systems.
Reported outcome magnitudes are repeatable: complaints and emergency calls are down by roughly two-thirds, response/repair times are down by ~40%, unplanned downtime is down ~28–35%, and energy/consumables are down ~20%.
Success correlates with embedding IoT signals into existing workflows and systems, supported by structured change management with local champions and visible executive sponsorship. Barriers are likewise practical: resistance to new practices, integration with legacy/multi-vendor estates, and connectivity/security constraints. Where these constraints dominate, payback windows extend to 13–24 months; where they do not, outcomes consolidate within a year.
Alongside the “hard” savings, respondents consistently highlighted non-financial gains, such as audit-grade transparency, predictable operations, and higher team confidence, that stabilize performance and reduce indirect costs.
This study is based on self-reported, quantified results and reflects industry, baseline, and maturity variation. Even with these limits, the pattern is clear: IoT delivers measurable improvements and cash-generative profiles on an annual planning horizon when treated as an operations system.
For executives, the data provides a realistic envelope for expected results and a practical lens for sequencing: outcomes are driven by the fit to process, the quality of integrations, and the discipline of measurement.
Looking to validate the business case and scope an IoT rollout? SumatoSoft can help you define the use cases, the data you actually need, and how the results will be measured in your operational and financial systems. Contact us to start with a short discovery and a pilot plan focused on payback and integration fit.
References
We would like to thank all companies that participated in this research.
Field services and trades
- Service First Plumbing — Steven Bahbah (Managing Director) servicefirstplumbing.com.au
- Rowlen Boiler Services — Lara Woodham, Director, rowlen.co.uk
- Hello Electrical — Jason Rowe, Director & Founder, helloelectrical.com.au
- AB Electrical & Communications — Adam Bushell, Director/Electrician, abelectricians.com.au
- Blue Diamond Towing — Hani Alkayali, President, bluediamondtowingllc.com
- Scale Lite Solutions — Keaton Kay, Founder & CEO, scalelitesolutions.com
Manufacturing and industrial
- FastPreci — Jacky Chow, COO, fastpreci.com
- Kelbe Brothers Equipment — Jeffrey J. Miller, President & CEO, kelbebros.com
- Influize — Liam Derbyshire, CEO / Founder, influize.com
Facilities, property, and building operations
- DASH Symons — Dave Symons, Managing Director, dashsymons.com
- Festoon House — Matt Little, Founder and Managing Director, festoonhouse.com.au
- VIA Technology — Manuel Villa, President & Founder, 800viatech.com
Fleet and logistics
- Blue Diamond Towing — Hani Alkayali, President, bluediamondtowingllc.com
- Kelbe Brothers Equipment — Jeffrey J. Miller, President & CEO, kelbebros.com
Events and venues
- The Great American Franchise Expo — Ted O’Shea, Tradeshow Event Manager, franexpousa.com
- Funraise — Justin Wheeler, CEO, funraise.org
- Festoon House — Matt Little, Founder and Managing Director, festoonhouse.com.au
Healthcare and life sciences
- MicroLumix — Debra Vanderhoff, Founder, microlumix.com
Public sector and city services
- VIA Technology — Manuel Villa, President & Founder, 800viatech.com
Retail and consumer products
- Desky — John Beaver, Founder, desky.com
- BirdieBall — Katie Breaker, Director of Sales & Marketing, birdieball.com
Education and training
- PMTI (Project Management Training Institute) — Yad Senapathy, Founder & CEO, 4pmti.com
- AlgoCademy — Mircea Dima, Founder/CEO/CTO, algocademy.com
Platforms and IT operations with IoT telemetry
- Action 1 — Peter Barnett, VP Product Strategy, action1.com
- Luppa AI — Dhanvin Sriram, CEO & Founder, luppa.ai
- Brizy — Bogdan Condurache, CPO, brizy.io
- Loio — Yehor Melnykov, CEO, loio.com
- FuseBase — Pavel Sher, CEO, thefusebase.com
- Fantasy.ai — Georgi Dimitrov, CEO, fantasy-ai.app
- Overcode — Vladyslav Makoveychyk, Head of Web Dev, overcode.tech
- GeeksProgramming — Rahul Jaiswal, Senior SEO Consultant & Head of Project Management, geeksprogramming.com
- Fig Loans — Jeffrey Zhou, Founder & CEO, figloans.com
- Zapiy.com — Max Shak, Founder & CEO, zapiy.com
- Digital Business Card — Alex Vasylenko, Founder, digitalbusinesscard.com
- Clever Offers — Thomas O’Shaughnessy, President of Consumer Marketing, cleveroffers.com
- Insertion.io — Aarish Akrama, Marketing Head, insertion.io
- Profit Value — Abdul Moeed, Outreach Specialist, profitvalue.net
Fitness and gyms
- Just Move Fitness Club — Pleasant Lewis JMAC, Owner, justmovefitnessclub.com
Let’s start
If you have any questions, email us info@sumatosoft.com


